HeatMaps
Detailed information about your viewer's reaction to your video
OVERVIEW
We have provided you with the Heatmap, a very useful analytics feature where you will get a detailed view of how your audience has engaged with your videos. Even though it is a subsection in the Video Analytics page of the video, it can give you a great idea of how your video is engaged by your audience.
HEATMAPS
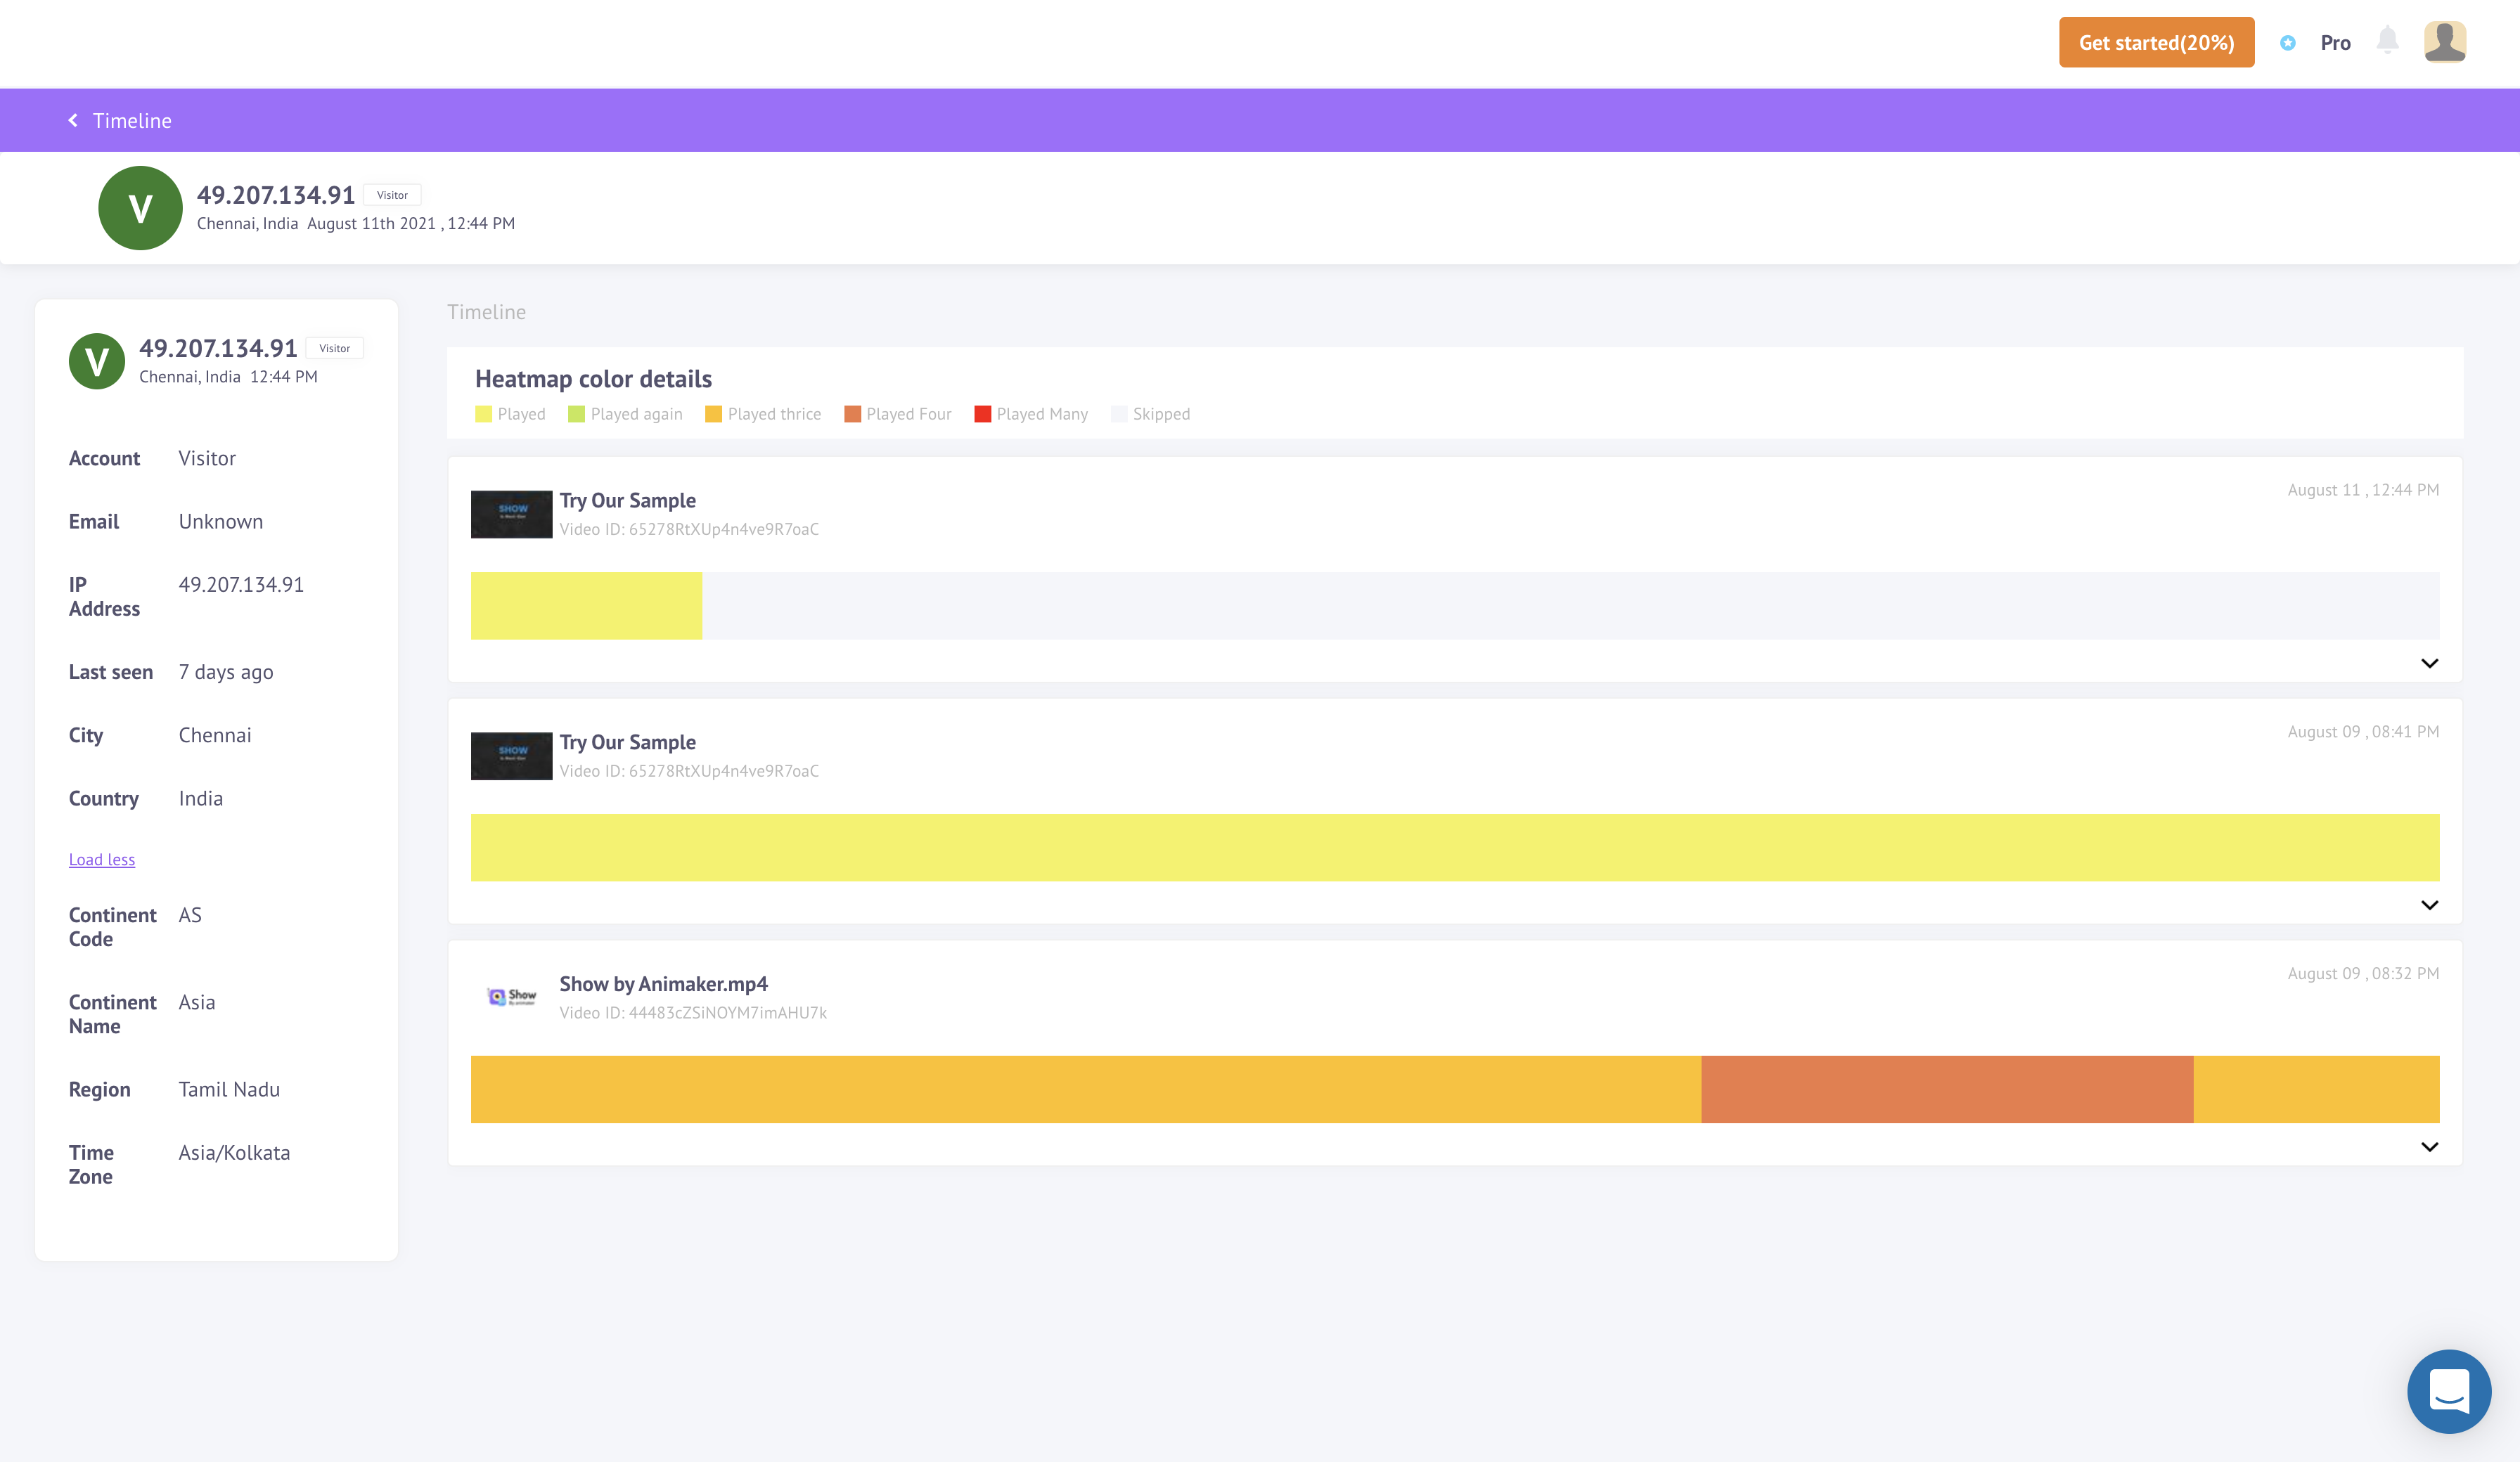
Heatmap is a graphical representation of how a single viewing session of your video went. Each time a viewer plays the video, he/she is assigned a heatmap, which shows their specific interaction with the video. Basically, you are given a second-by-second detail of how your viewer engaged with your video.
You can see how each viewer engages with the video for that particular session and each engagement or action is given a color, like,
How many times did they watch the video?
Number of times they rewatched the same segment.
Number of times they skipped parts of the video, etc.
In short, it doesn't matter how many viewers watch your video, each one gets a specific heatmap for each session they have engaged with your video.
Basic Heatmap Information
The basic information that Heatmaps provide include,
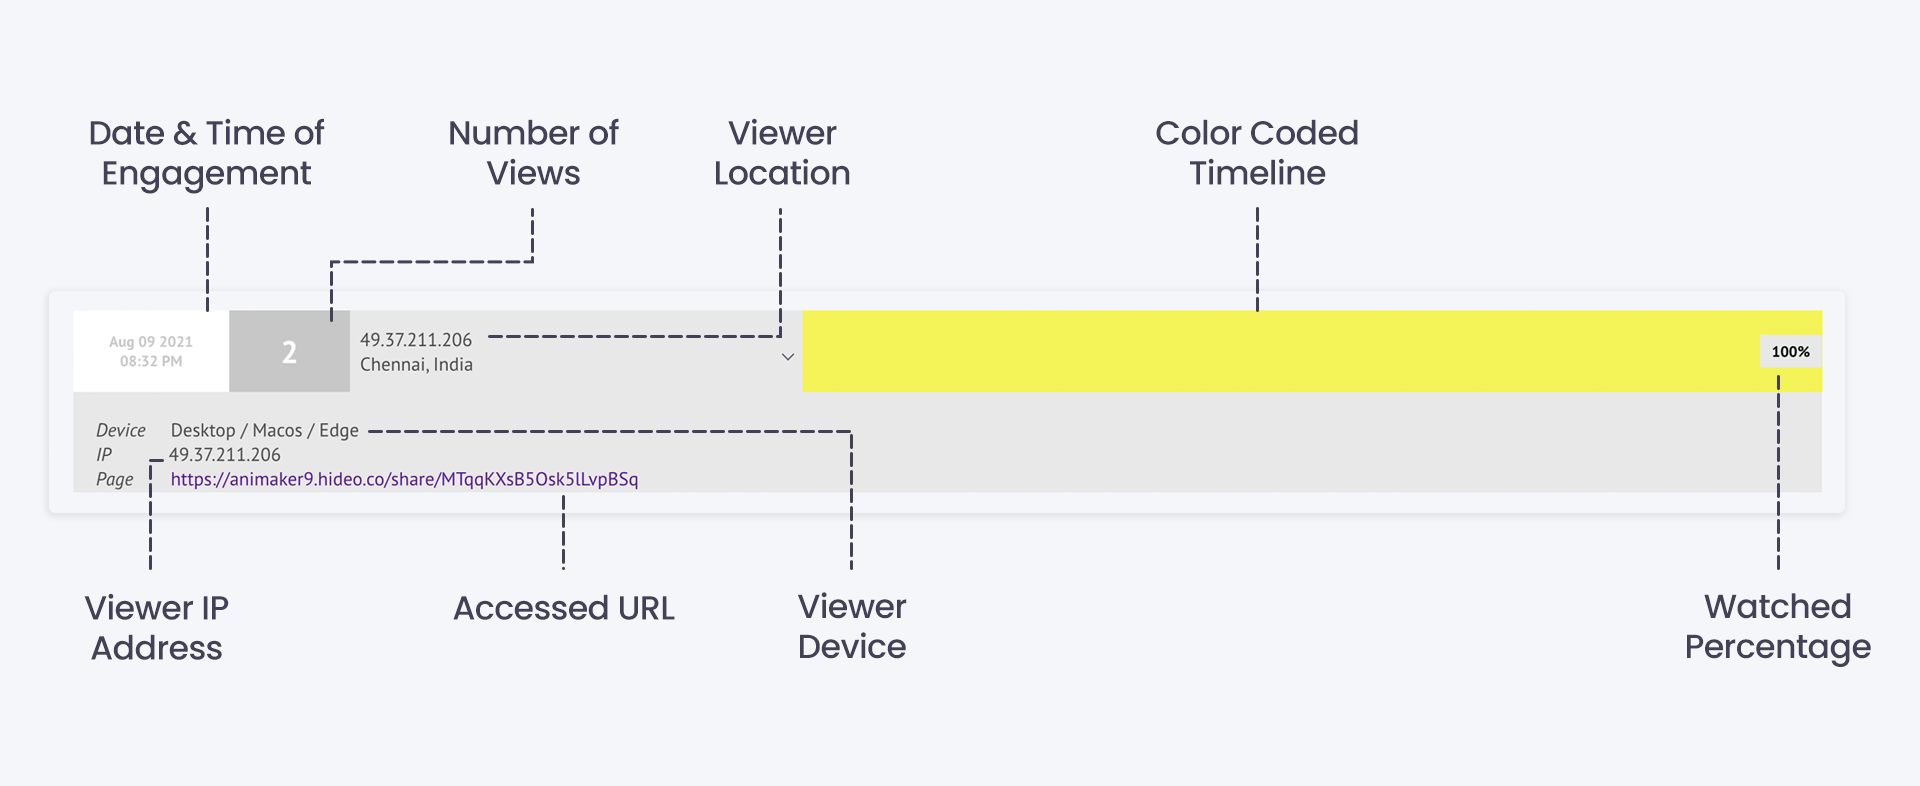
- Date and Time of Engagement: will tell you the time and date when the viewer watched the video for the first time, i.e., when they first opened the session to watch the video.
- Number of Views: will tell you how many times this viewer has watched your video in this session.
- Viewer Data: will give you the information about the viewers, like, ' their location', 'their device', 'their IP addresses', and 'the URL they accessed to view the video'.
- Color-Coded Timeline: will give you information of how many times your video was watched, skipped, rewatched, etc.
- Percentage of video played: found at the extreme right of the heatmap will give the percentage of the video the viewer watched. If the viewer watched the video multiple times, it is still considered as a single time, i.e., 100%.

Heatmap Information
COLOR CODES IN HEATMAPS
The different color codes determine the different actions performed by the viewer. For Instance, each time a viewer skips a portion or portions of the video, that part is colored white. So, the color codes are applied to each portion of the video depending on how many times the viewers watched the video.
The color codes are explained in the table below.
Color | Description |
|---|---|
WHITE | The portion(s) of the video the viewer skips is colored white. |
YELLOW | The portion(s)of the video the viewer watches once is colored Yellow. |
GREEN | The portion(s)of the video the viewer watches twice is colored Green. |
ORANGE | The portion(s) of the video the viewer watches thrice is colored Orange. |
RED | The portion(s) of the video the viewer watches more than 3 times is colored Orange. |

Updated 9 months ago